
In the previous years’ Pennsylvania Standardized Student Assessments, the number of students across the state that received a proficient score was low, declining from previous years. According to the PA Future Ready Index, a database providing scores and demographics of PA students, high schoolers achieved 51.4% language arts and literature proficiency and 35.7% algebraic mathematics proficiency. LM students performed impressively well relative to the statewide results in the previous school year. Far exceeding standards, 94.7% and 79.8% of LM students scored a proficient mark in English and math assessments, respectively. However, these numbers fail to tell the whole story.
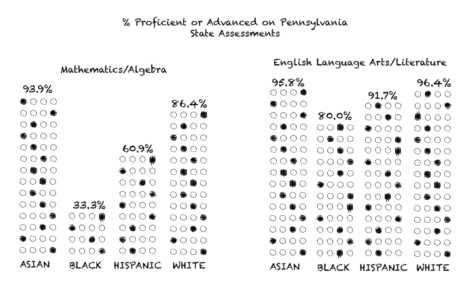
When the data is subdivided by demographics, the numbers reveal racial disparities in the test scores. Focusing on the English exam, the scores from the white and Asian students from our school are similar. White students achieved 96.4% proficiency, while Asians recorded 95.8%. Hispanics followed with 91.7% proficiency on the test and Black students lagged behind, with 80% achieving proficiency.
The math test data reveals this unfortunate trend to a further degree. LM Asian students topped the scores, with 93.9% of students achieving proficiency, and white students finished with 86.4% proficiency. Hispanic and Black students had significant differences in scores in comparison to Asian and white students, logging only 60.9% and 33.3% respectively. In addition, both Hispanic and Black students saw drops from the previous year, indicating worsening racial disparities with regard to the test scores.
Another notable difference observed was the ways in which economic realities contributed to scores, as they represent major factors in academic performance. Different financial situations greatly affect whether students have adequate materials, books, computers, stable internet access, and other resources to facilitate learning.
However, with the generous funding our school receives, economic disadvantage seems to have less of an impact at LM than at other schools. For instance, while 80.6% of LM’s economically disadvantaged students scored proficient on the Keystone exams, only 2.4% at Overbrook High School achieved this level. The difference is that Overbrook High School is 99% economically disadvantaged, and is not able to provide the resources that LM can.
Multiple factors present as explanations for these differences. LM is predominately white (65.0%), and has three minority groups largely making up the rest of the student body: Asians (10.9%), Blacks (12.0%), and Hispanics (5.8%). There are multiple potential explanations for the imbalance. Perhaps LM minority students are not receiving the educational support they need. Another possibility might be the economic differences within racial groups play a major factor that is not shown in the available data, as the demographics of those considered economically disadvantaged are not available.
LM is not the only school experiencing this trend. Schools across the country have begun to observe the racial disparities in both standardized test performance and cumulative GPA. The National Center for Education Statistics (NCES) reports the following for average GPAs on a 4.0 scale across U.S. high schools: Asian (3.26), white (3.09), Hispanic (2.84), Black (2.69). Even in our well-funded and progressive school, national data remains consistent with our test scores. It would be important to know if GPA averages at LM track with the national data, but this information is not available.
Taken together, the local and national data suggest that high schools could put more effort into understanding and rectifying racial disparities. According to the Nation- al Library of Medicine, “evidence consistently suggests that schools can play an active role in the provision of opportunities for social mobility or in the exacerbation of social inequality, depending on how they are structured.” LM has taken recent strides however to promote educational equity. The district hired Shawanna James-Coles to be the new Diversity Equity and Inclusion (DEI) Director back in April. LMSD has recently also introduced initiatives and practices to close the educational equity gap. This includes the District’s Equity Policy, which will be conducted through January 2023.
It is no secret that school districts across America have struggled to close the gap in grades amongst different races. Clearly, LM and LMSD empha- size the need for educational equity. Will our new initiatives help to solve the problem, or will the cycle be perpetuated? That is left to be determined.